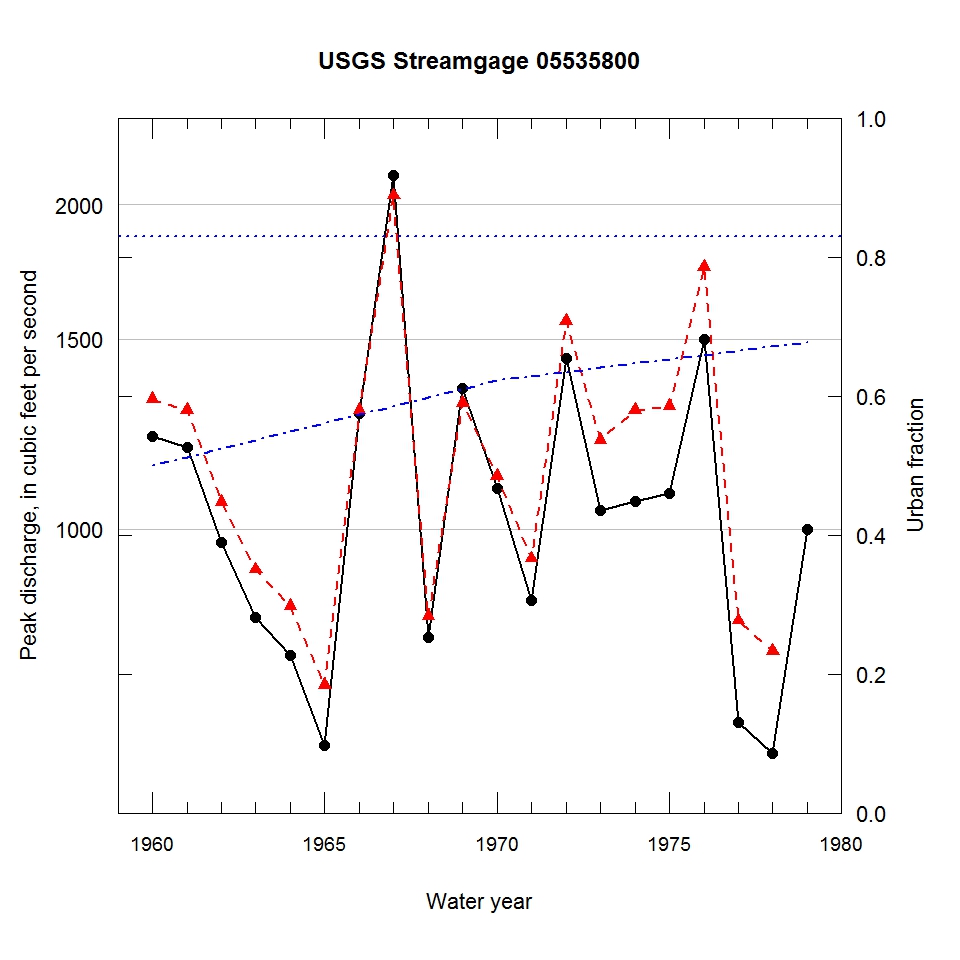
Observed and urbanization-adjusted annual maximum peak discharge and associated urban fraction and precipitation values at USGS streamgage:
05535800 NORTH BRANCH CHICAGO RIVER AT MORTON GROVE, IL


| Water year | Segment | Discharge code | Cumulative reservoir storage (acre-feet) | Urban fraction | Precipitation (inches) | Observed peak discharge (ft3/s) | Adjusted peak discharge (ft3/s) | Exceedance probability |
| 1960 | 1 | 2 | 0 | 0.500 | 0.385 | 1220 | 1320 | 0.345 |
| 1961 | 1 | -- | 0 | 0.512 | 1.402 | 1190 | 1290 | 0.378 |
| 1962 | 1 | -- | 0 | 0.524 | 0.227 | 971 | 1060 | 0.561 |
| 1963 | 1 | -- | 0 | 0.536 | 1.116 | 827 | 917 | 0.698 |
| 1964 | 1 | -- | 0 | 0.549 | 0.883 | 763 | 848 | 0.757 |
| 1965 | 1 | -- | 0 | 0.561 | 0.166 | 629 | 716 | 0.857 |
| 1966 | 1 | -- | 0 | 0.573 | 1.315 | 1280 | 1290 | 0.371 |
| 1967 | 1 | -- | 0 | 0.585 | 1.655 | 2130 | 2040 | 0.082 |
| 1968 | 1 | -- | 0 | 0.598 | 1.196 | 793 | 830 | 0.771 |
| 1969 | 1 | -- | 0 | 0.610 | 1.680 | 1350 | 1310 | 0.357 |
| 1970 | 0 | -- | 961 | 0.622 | 1.549 | 1090 | 1120 | 0.514 |
| 1971 | 0 | -- | 961 | 0.628 | 0.379 | 859 | 939 | 0.676 |
| 1972 | 0 | -- | 961 | 0.634 | 1.455 | 1440 | 1560 | 0.203 |
| 1973 | 0 | -- | 1561 | 0.640 | 1.202 | 1040 | 1210 | 0.435 |
| 1974 | 2 | -- | 1561 | 0.647 | 1.090 | 1060 | 1290 | 0.376 |
| 1975 | 2 | -- | 1561 | 0.653 | 0.798 | 1080 | 1300 | 0.364 |
| 1976 | 2 | -- | 1561 | 0.659 | 1.354 | 1500 | 1750 | 0.147 |
| 1977 | 2 | -- | 1561 | 0.665 | 0.803 | 661 | 822 | 0.777 |
| 1978 | 2 | -- | 1561 | 0.671 | 1.344 | 619 | 770 | 0.817 |
| 1979 | 0 | -- | 2961 | 0.677 | 0.824 | 1000 | -- | -- |

